|
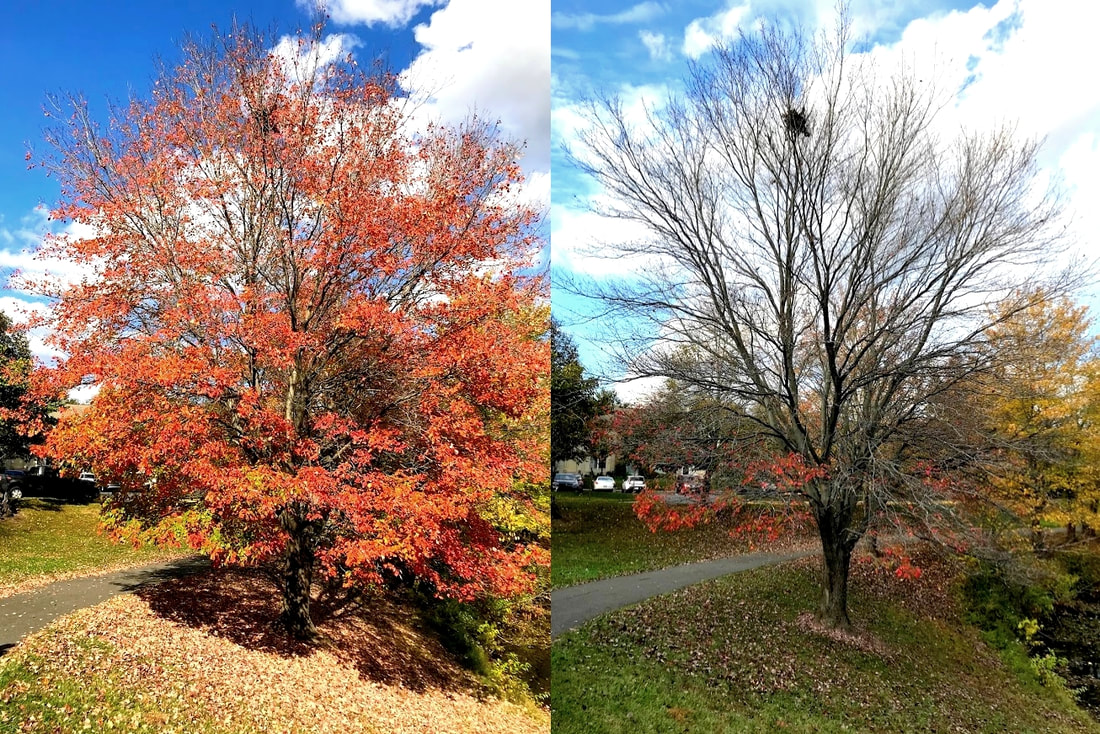
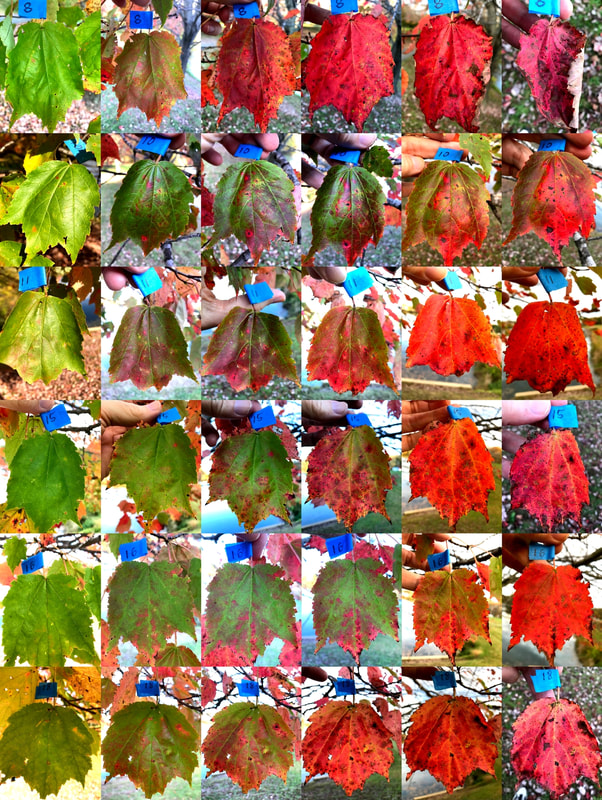
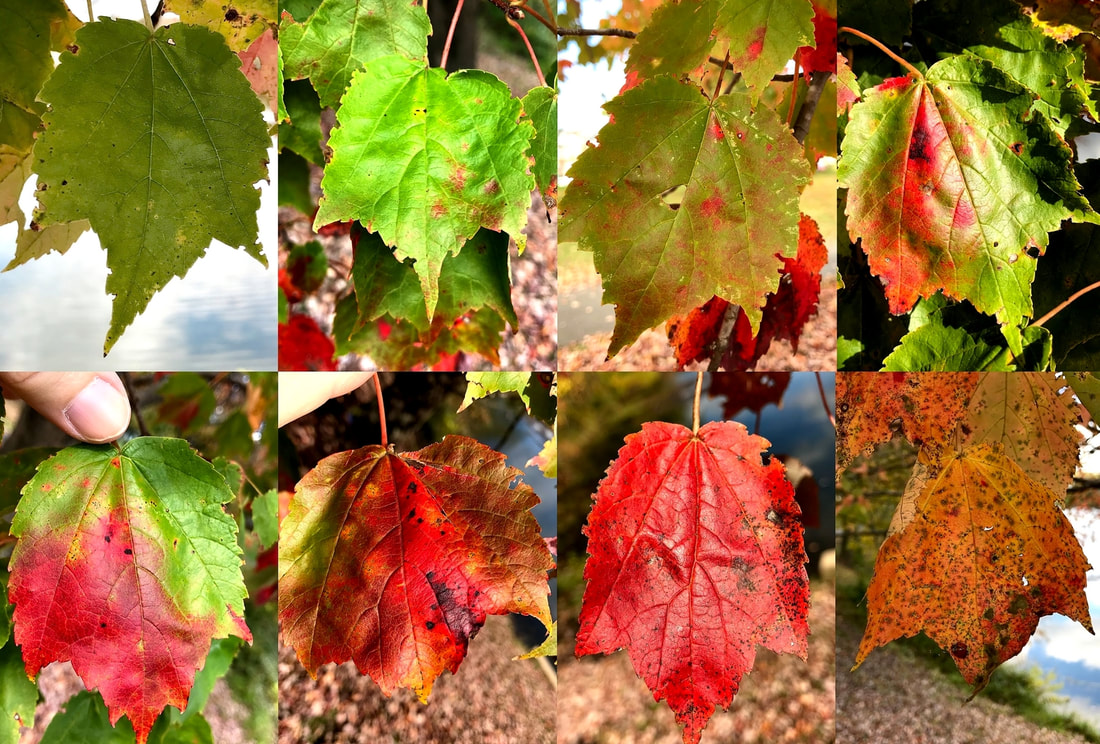
10/31/2020 Employing the Timeline and Cross-Sectional Methods to Study the Change in the Color of Leaves During AutumnRead NowScientists often need to evaluate how a group of entities changes over time in response to some natural or man-made processes. Such entities can be the animals or plants belonging to a species, or they can be non-living things such as the glaciers, rivers, or mountains in a given area. To do this, scientists could try to study all the entities they want to evaluate, but this is often too costly, impractical, or impossible. So to make possible this evaluation, scientists may use one of two methods. I will illustrate these methods by applying them to the study of the change in leaf color during the fall. The Timeline Method The first method is the timeline method. This method involves following some entities over time during the period of interest and documenting how they change. The idea is then that the change of the overall population or group can be extrapolated from the change of the particular entities that are followed. I used the timeline method to document how the leaves changed during one week in the autumn in a maple tree in my neighborhood. The genus of maples is Acer, but I don’t know the species of this particular tree. The color of the majority of the leaves of the tree had already begun to change and many had already fallen. I selected several of the low lying leaves that were still mostly green, wrapped the stems with tape, assigned them a number, and photographed them. Over the next six days I came back more or less at the same time of day taking pictures of the leaves I had selected. During those 6 days the tree lost most of its leaves as can be seen below. I show below the change in leaf color of six leaves on the tree over the observation period of six days. Each column corresponds to one day. Some of the leaves fell between days 5 and 6, but I was able to retrieve them from the ground and photograph them. You can see that the leaves change color at different rates and the transition is far from homogeneous. In some cases there are spots of intense red color that appear and then spread, whereas in other cases the green over an area of the leaves fades and is replaced by a diffuse red. The green color is, of course, the pigment chlorophyll which is degraded during the fall. In the particular case of maples, as chlorophyll is degraded, the leaves produce another pigment called anthocyanin which is responsible for the red color and may play a protective role during leaf senescence. The timeline method will work best if the entities under study and the way they change are representative of the overall population under study. As the leaves I chose to study were the most accessible ones at the bottom of the tree, they may not be wholly representative of the changes in the leaves at the top of the tree. Other differences may be caused by variables such as disease, amount of available sunlight, etc. Ideally I should have taken a larger sample from leaves in different parts of the tree at several heights and evaluated them over time. The Cross-Sectional Method As you saw above, at any given time there are a number of leaves at different stages of their color changing process. This fact allows the application of the cross-sectional method. To apply this method, I photographed several leaves in the first day (a cross section in time) and using these leaves I put together a possible sequence of leaf color change that describes the overall process as shown below from top left to bottom right. The cross-sectional method involves much less work than the timeline method, and is intended to be an overall representation of the change of leaf color in the tree. However, care must be taken in selecting the individual leaves to put together the representative leaf change sequence. There are some obvious differences between the sequence I put together using the cross-sectional method and the changes displayed by the individual leaves using the timeline method. In particular, the appearance of the red color and its boundary in the cross-sectional sequence seems to be more vivid, sharper, and circumscribed than that displayed by the change in most of the individuals leaves I studied. If I repeat this study, I have to be more careful in my methodology and select a wider variety of leaves. The timeline and cross-sectional methods have many applications in science. An example of an application of the timeline method in the present is using radio-tracking technology (nowadays improved by satellite and GPS systems) and genetic monitoring to study movements of wildlife populations and the way they change over time. But scientists can also use the timeline method to study living things in the past. Because living things changing through time leave a sequential record of their change in rocks (fossils) and also to a certain extent in the stages of an embryo’s development, scientists can use fossils and embryology to piece together how organisms evolved over millions of years. The timeline method can also be applied to study how non-living things changed in the past. For example, scientists have measured the concentration of carbon dioxide (CO2) trapped in air bubbles inside the ice of the polar caps going back hundreds of thousands of years, obtaining important information regarding how this relates to atmospheric temperatures and global warming. Ideally the timeline method is preferable to the cross-sectional method, but the cross-sectional method is sometimes the method of choice if there are restrictions in time or resources available for the study, or in the case of processes that occur over very long intervals of time without leaving any records. Studying the genes or proteins of living organisms and comparing them to each other to figure out their interrelationships is an application of the cross-sectional method. A remarkable application of the cross-sectional method is the study of galaxy collisions. These events take billions of years, so it’s impossible to follow them over time. To study galaxy collisions, astronomers photograph galaxies in different stages of collision (cross section) and write programs to explain the different stages they observe in the process as described in the video below. The timeline and the cross-sectional methods allow scientists to peer back in time and uncover the changes that took place in the past and how they shaped the present, and to uncover which changes are taking place in the present and how they may shape the future. The photographs belong to the author and can only be used with permission.
0 Comments
|
Details
Categories
All
Archives
June 2024
|


 RSS Feed